Cyclic Immunofluorescence (CycIF) & Spatial Biology Services
High-plex multiplex immunofluorescence and spatial biology workflows for tumor microenvironment analysis, immune profiling, biomarker discovery, and translational research powered by Lunaphore COMET™ technology.
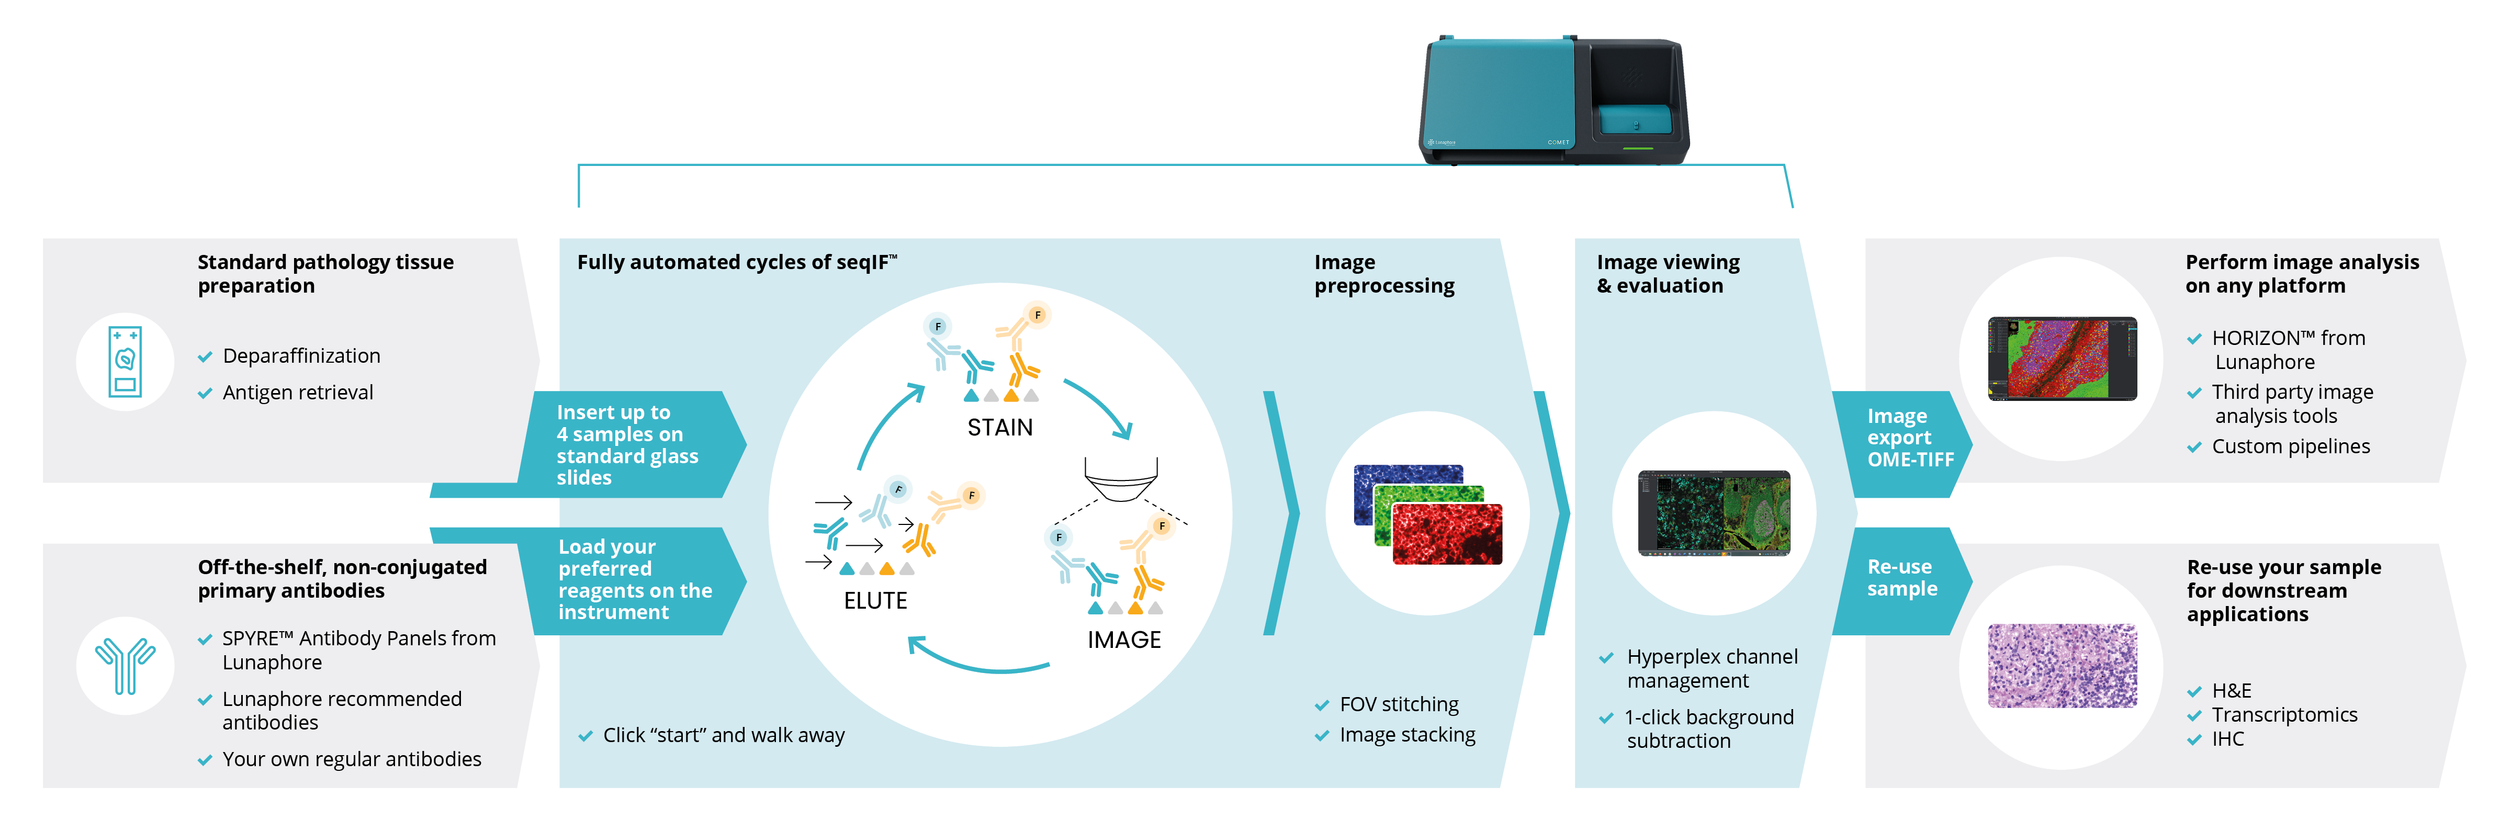
Lunaphore COMET™ Multiplex Tissue Imaging
Automated cyclic immunofluorescence workflows for scalable high-dimensional tissue imaging and spatial biomarker analysis.
What is Cyclic Immunofluorescence (CyCIF)?
CyCIF enables repeated cycles of antibody staining and fluorescence imaging to visualize dozens of protein biomarkers within intact tissue architecture while preserving spatial context and cellular organization.
Multiplex Immunofluorescence & Spatial Biology Services:
IMCO provides end-to-end CyCIF services including experimental design consultation, antibody panel optimization, tissue imaging, spatial analysis, and downstream bioinformatics support.
Why we use COMET cycIF in IMCO labs:
Ultra-high plexing: simultaneous visualization of 30+ markers in a single tissue section with precise spatial resolution.
Same slide H&E for AI driven data analysis.
Spatial biology, uncoupled from single-marker limitations: understand cell–cell interactions, neighborhoods, and microenvironment patterns.
FFPE-compatible workflows: work with routinely collected clinical samples without complex preprocessing.
Rapid, automated workflow: streamlined protocols reduce hands-on time and improve consistency.
Quantitative, reproducible data: standardized cycles enable robust image analysis and cross-sample comparability.
End-to-end readiness: integrates with our imaging platforms and data analytics to accelerate discovery and decision-making. Learn more about the Lunaphore Comet here.

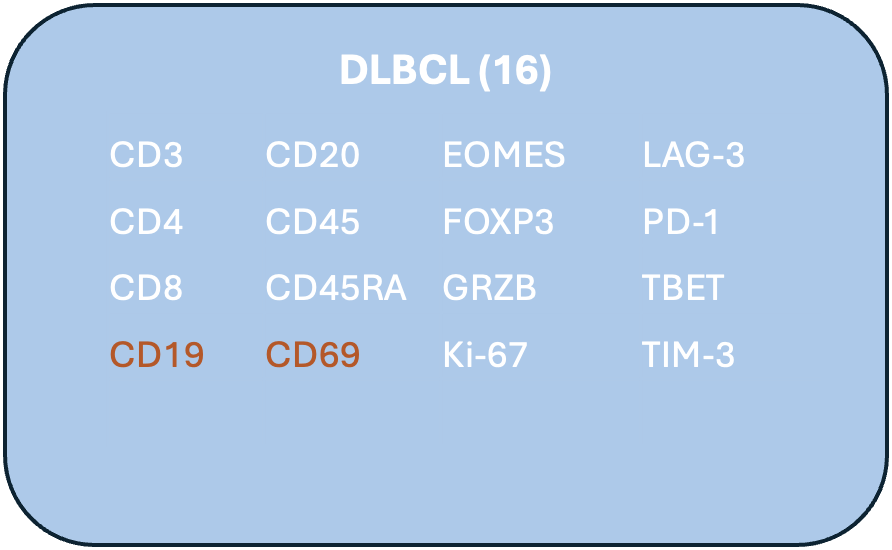
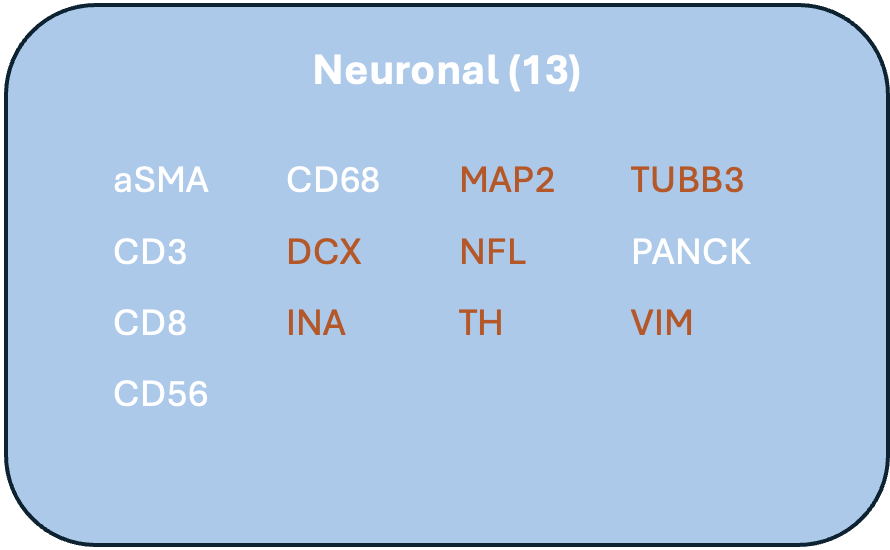
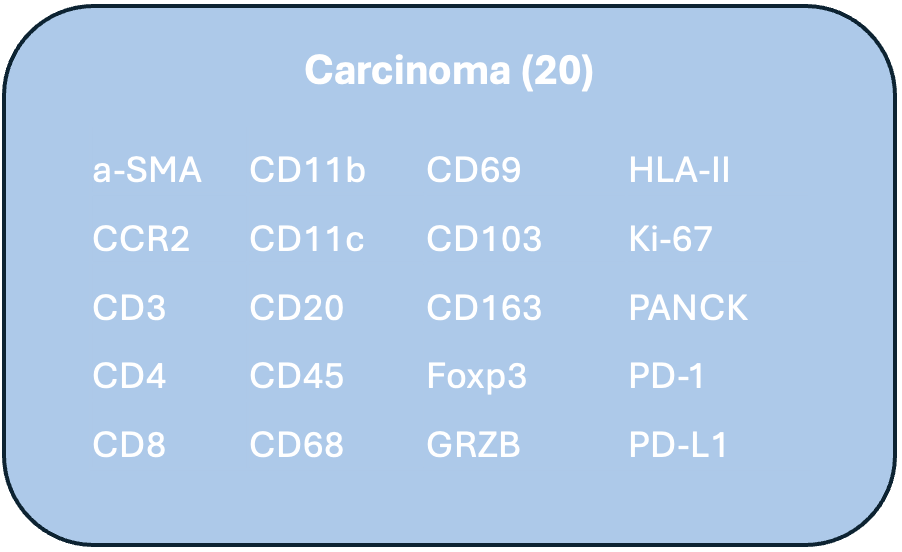
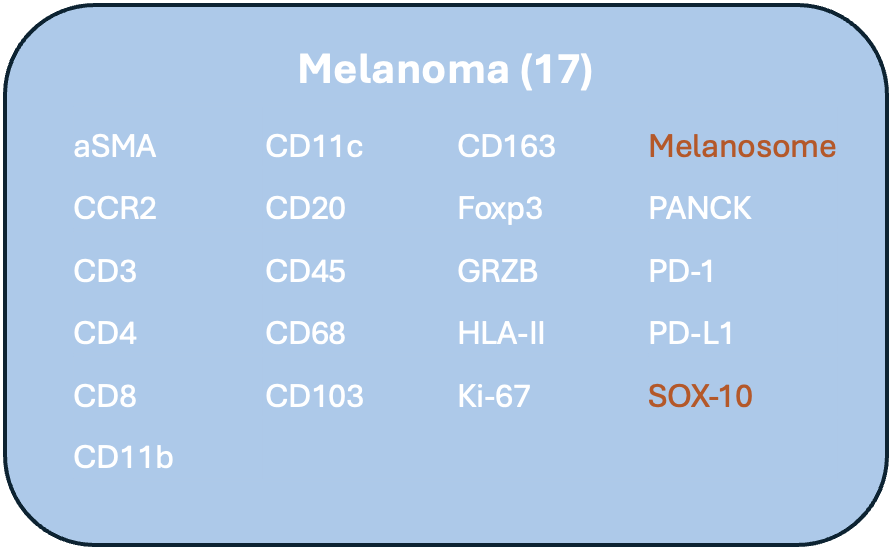
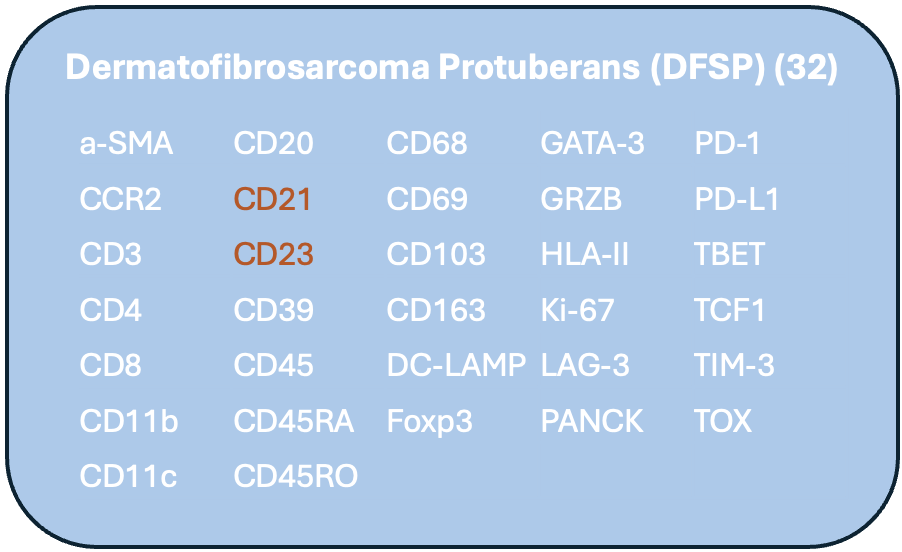
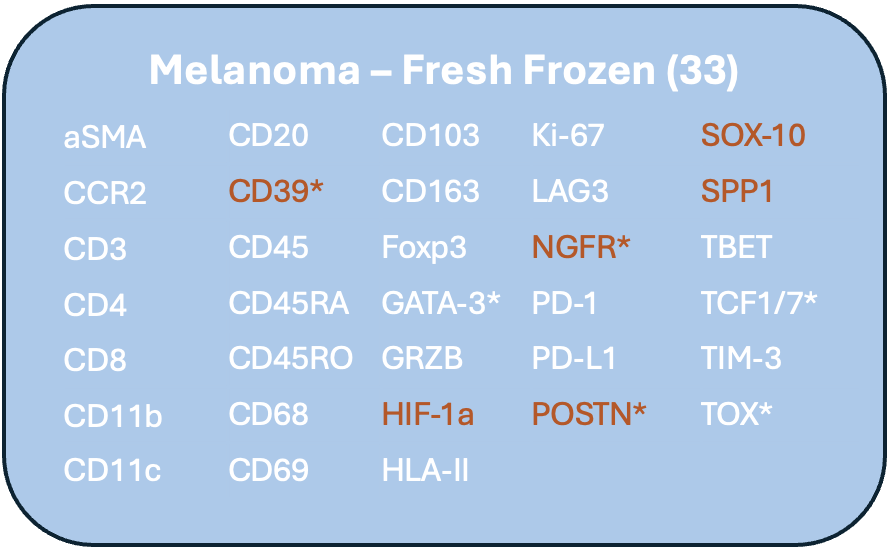
Featured Panels
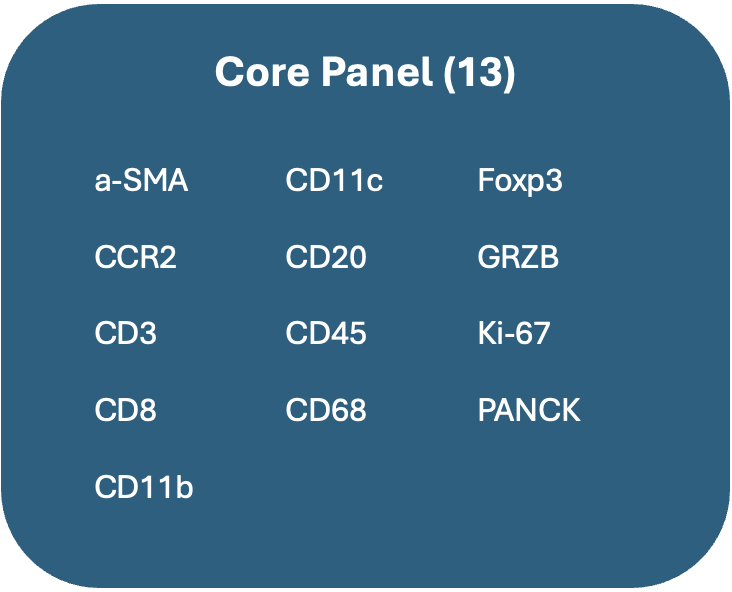
Core Panel
Targets: CD8 T Cells, Tregs, Th Cells, B Cells, Monocytes, Macrophages, DCs, Neoplastic Cells, Fibroblast-like Cells
Function: Proliferation, Cytotoxicity
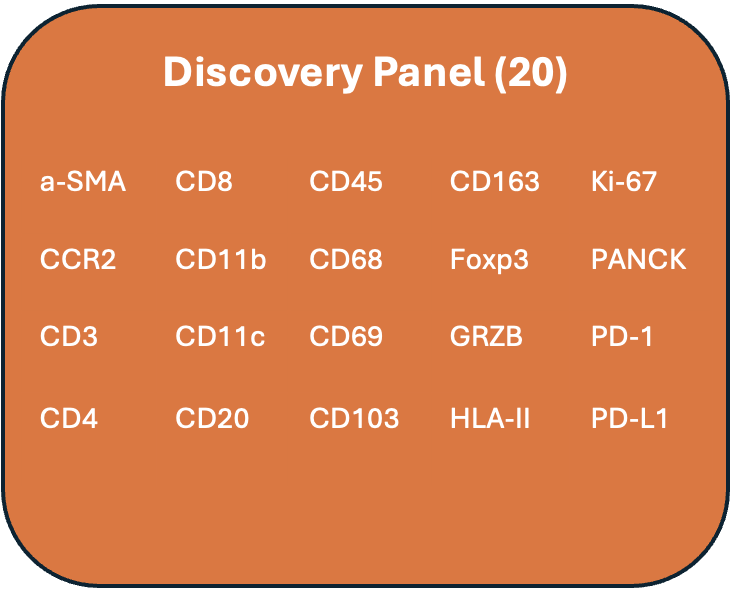
Discovery Panel
Targets: CD8 T Cells, Tregs, Th Cells, Unconventional T Cells, B Cells, Monocytes, Macrophages, DCs, Other APCs, Neoplastic Cells, Fibroblast-like Cells
Function: Proliferation, Activation, Checkpoint, Cytotoxicity, Tissue Residency, Anti-inflammatory(M2-like)
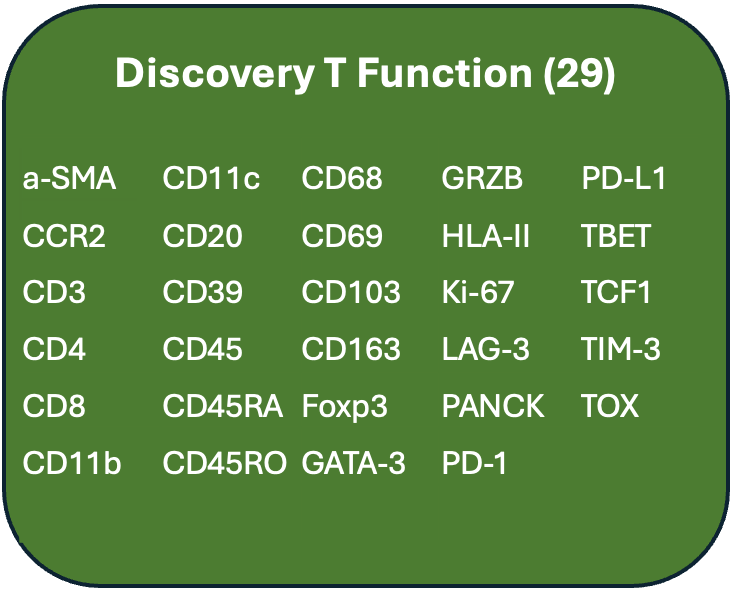
Discovery T-Function
Targets: CD8 T Cells, T-regs, Th1 Cells, Th2 Cells, Unconventional Cells, B Cells, Monocytes, Macrophages, DCs, Other APCs, Neoplastic Cells, Fibroblast-like Cells
Function: Proliferation, Activation, Cytotoxicity, Tissue Residency, Memory, Exhaustion, Self-renewal, Immunosuppression, Anti-inflammatory (M2-like)
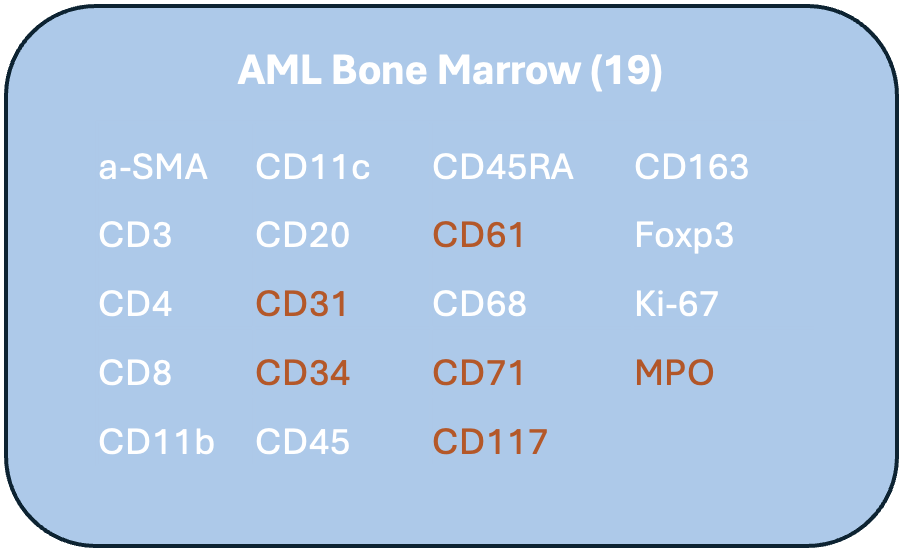
Custom Panels
Lunaphore at work
-
![A digital, neon-like abstract art piece featuring a human face outline in orange lines intertwined with blue digital particles on a black background.]()
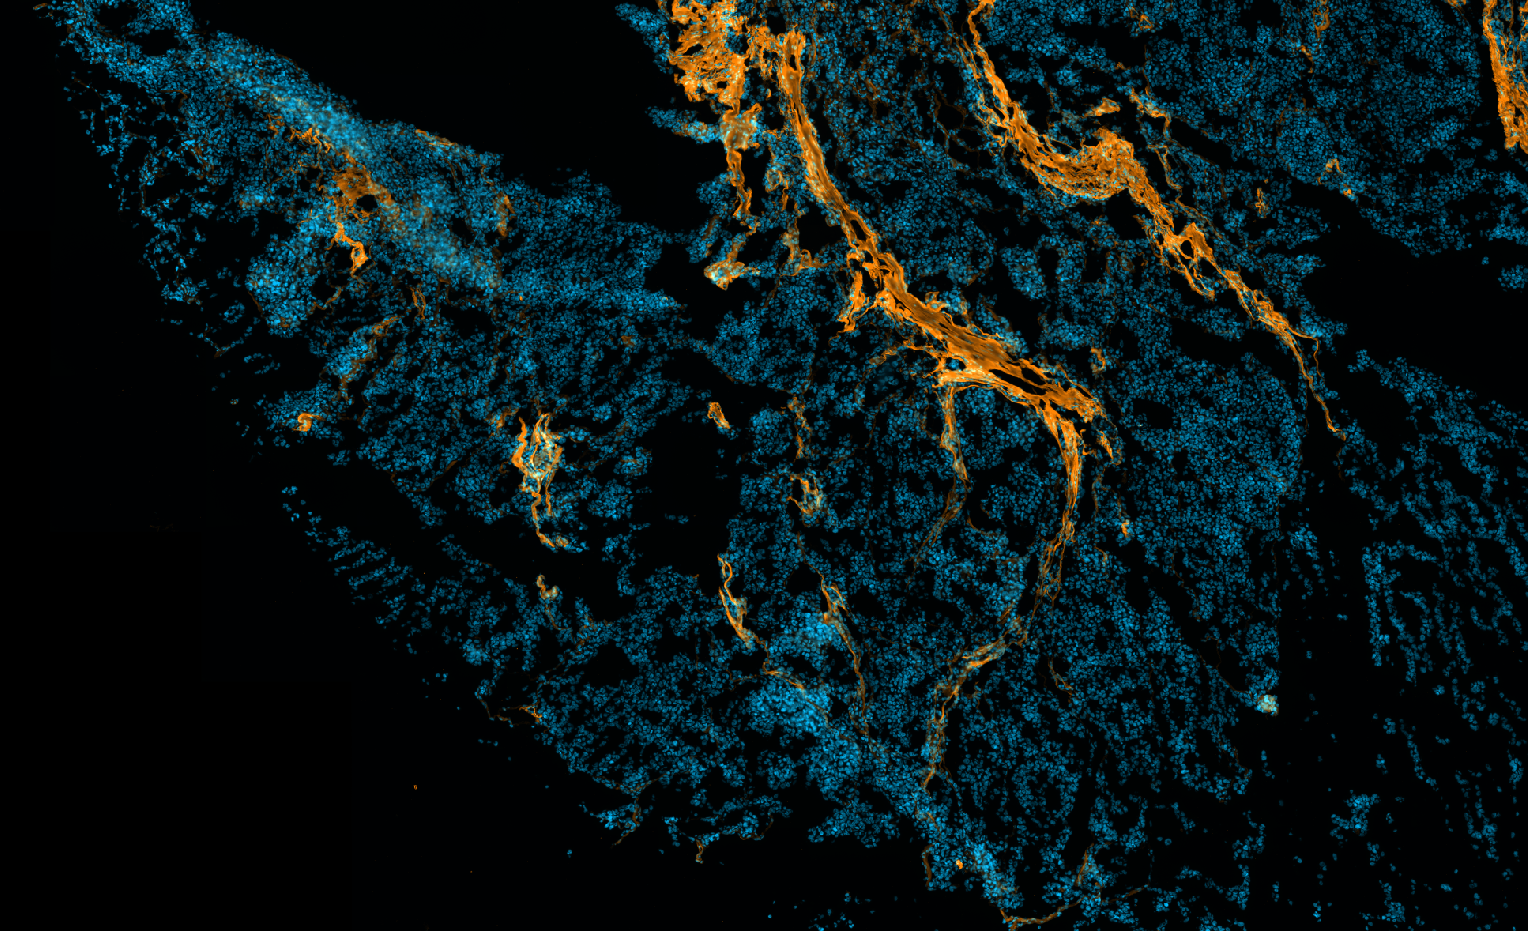
Melanoma: DAPI, POSTN
-
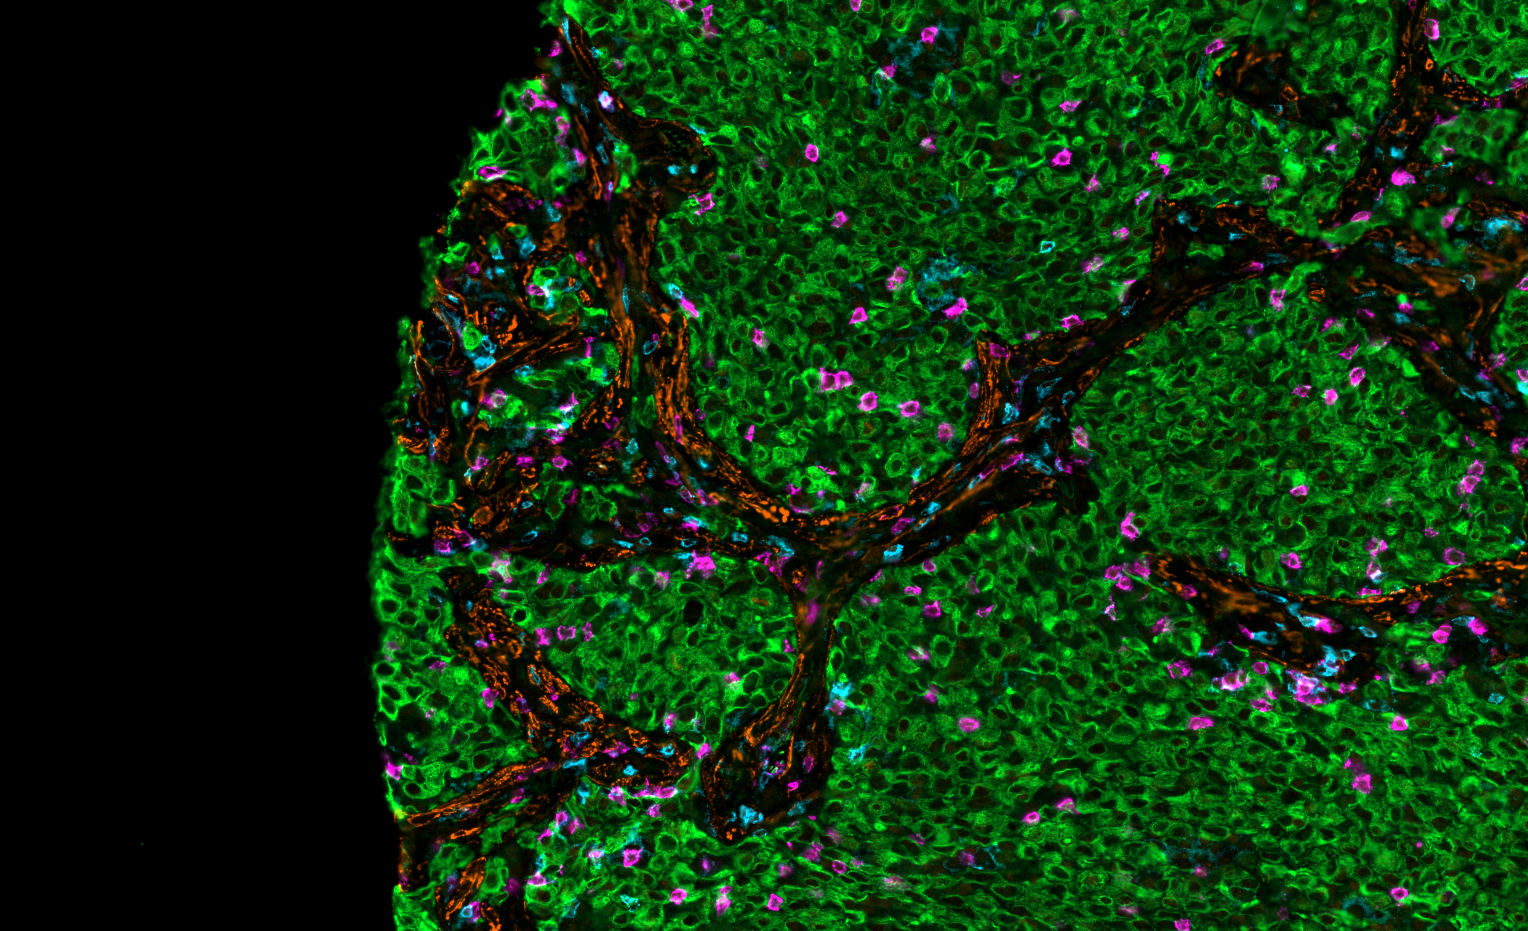
![Close-up of cells stained with fluorescent antibodies, showing green fluorescence on the left and multicolored fluorescence on the right, used for scientific research.]()
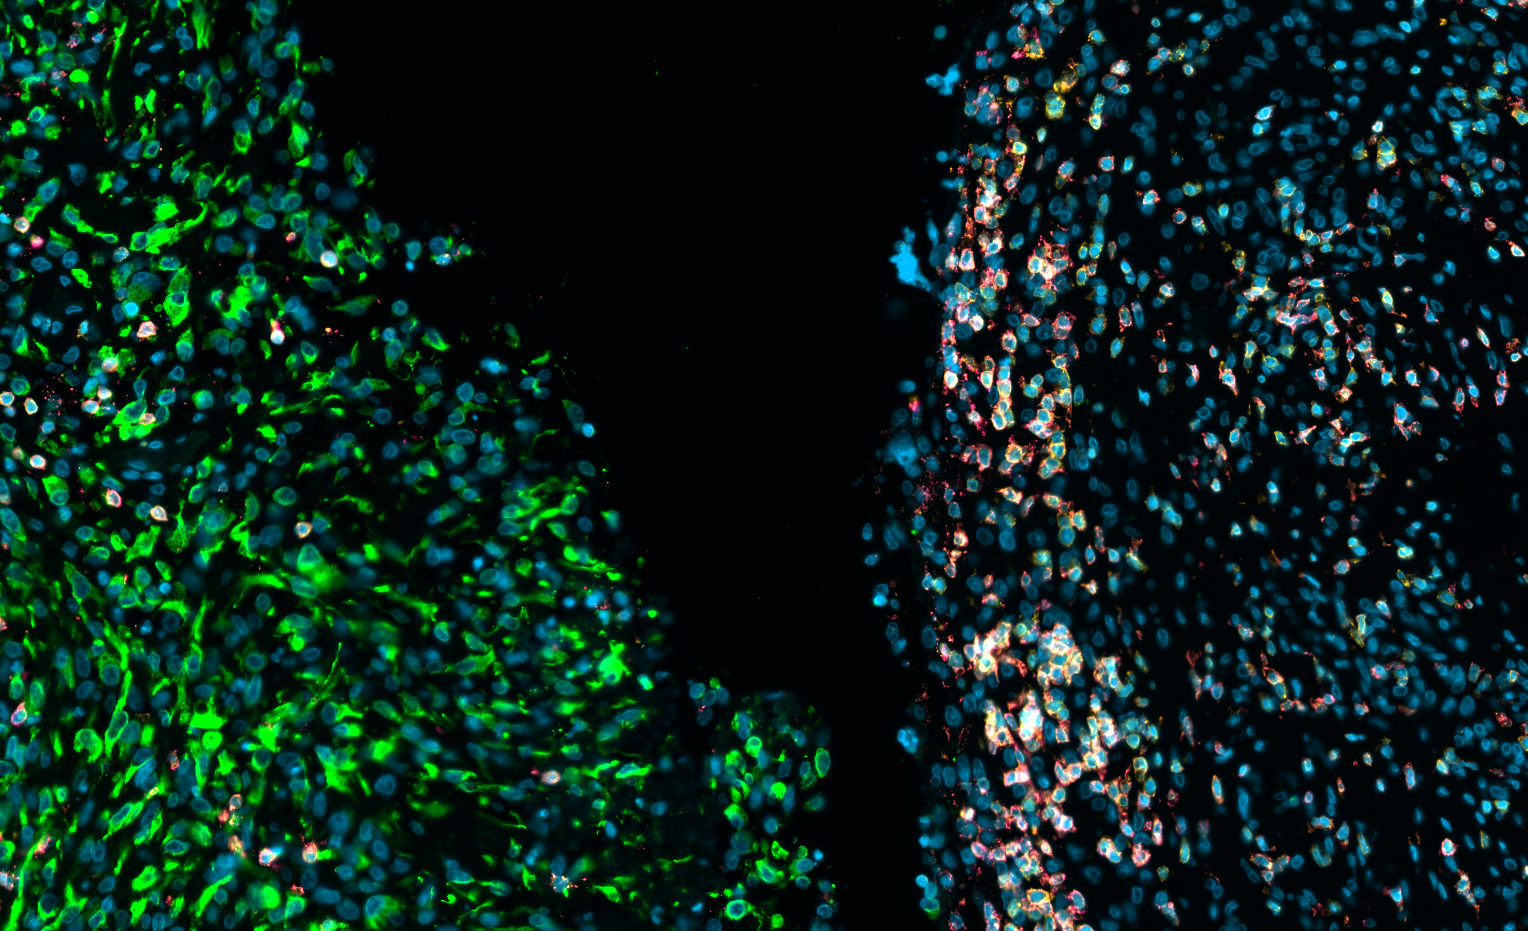
Sarcoma: CD3, CD8, Pan-CK
-
![Breast Cancer: Pan-CK, CD45]()
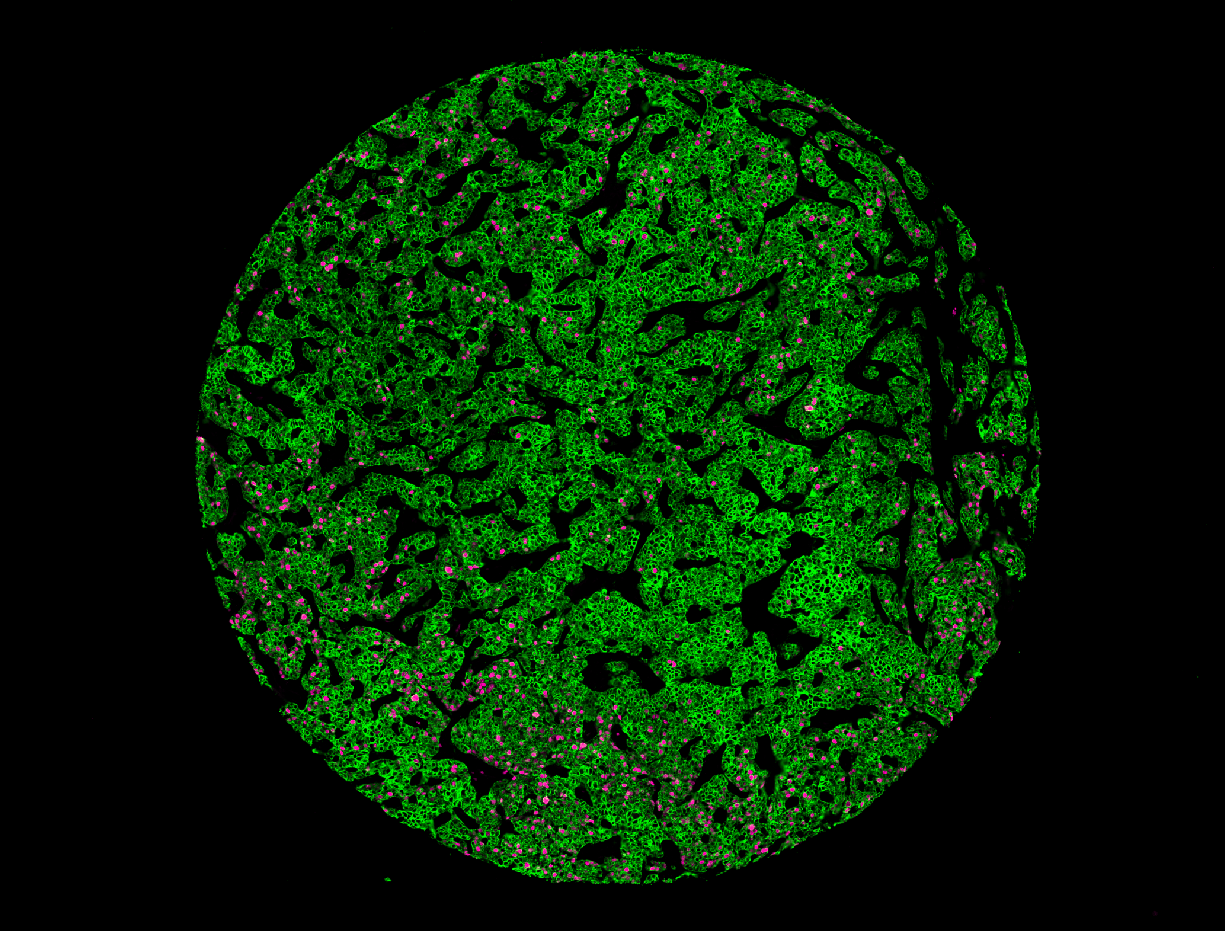
Breast Cancer: Pan-CK, CD45
-
![Breast Cancer: Pan-CK, CD45]()
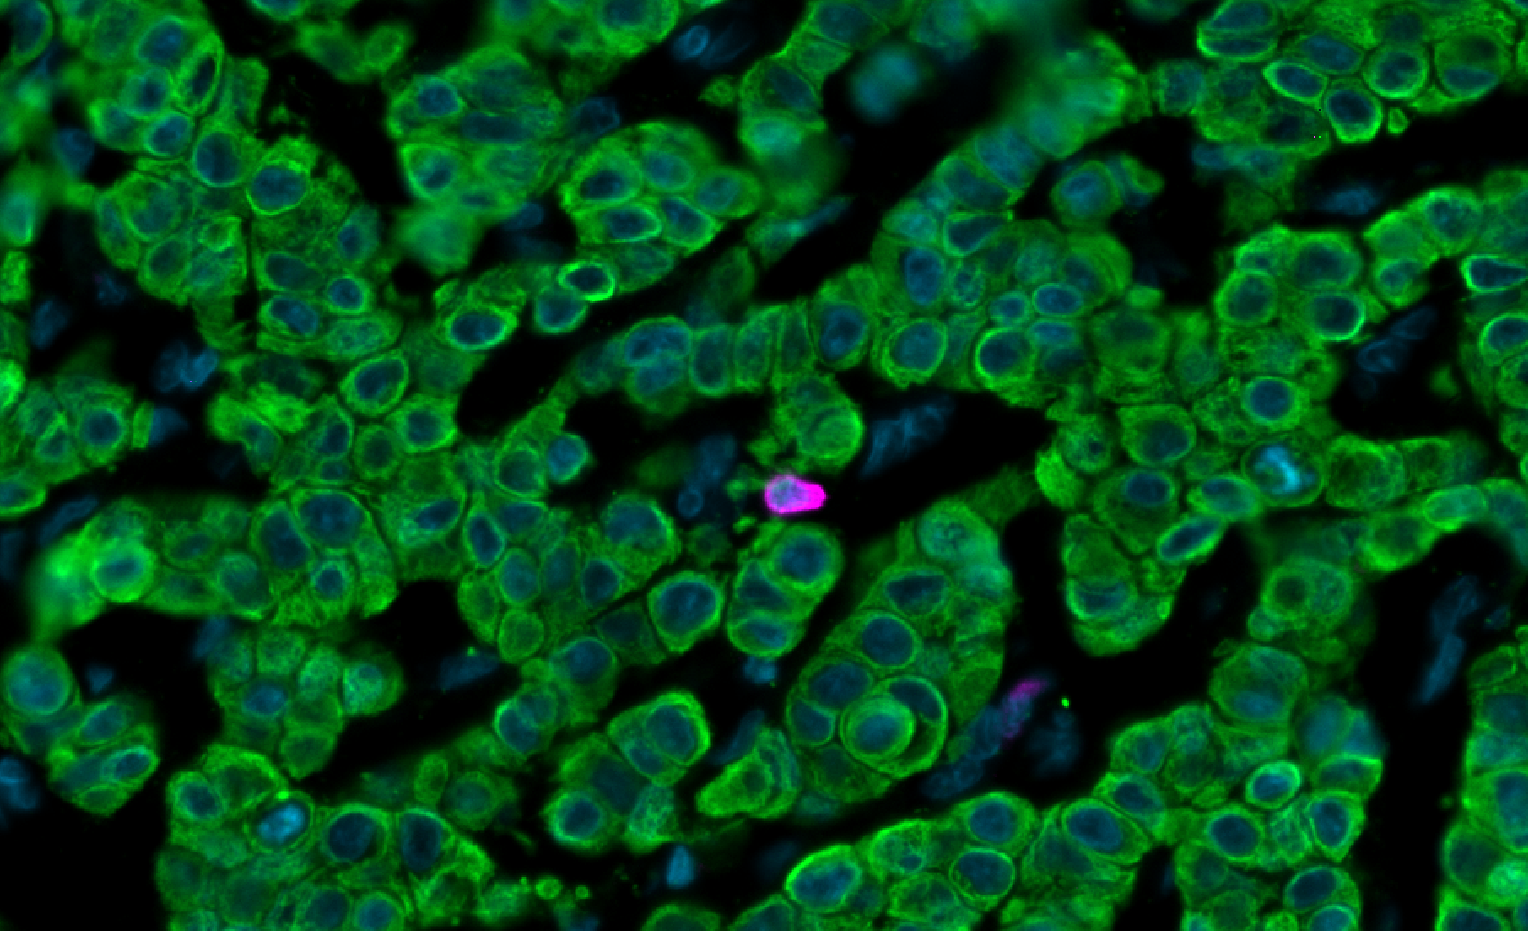
Breast Cancer: Pan-CK, CD45
-
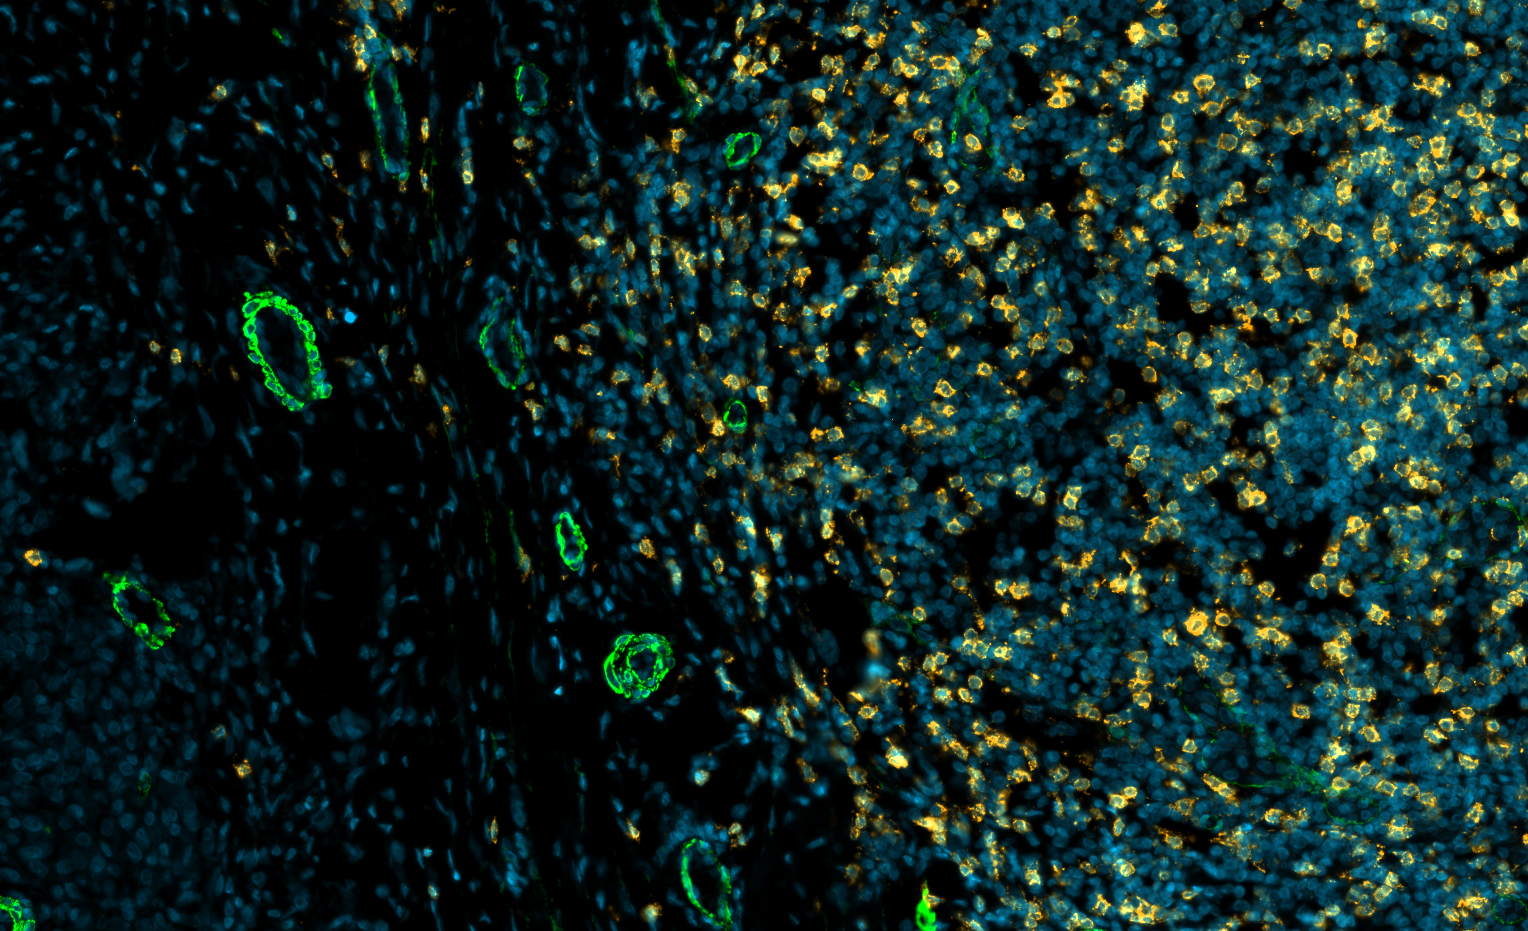
![Melanoma TLS: CD8, ASMA]()
Melanoma TLS: CD8, ASMA
-
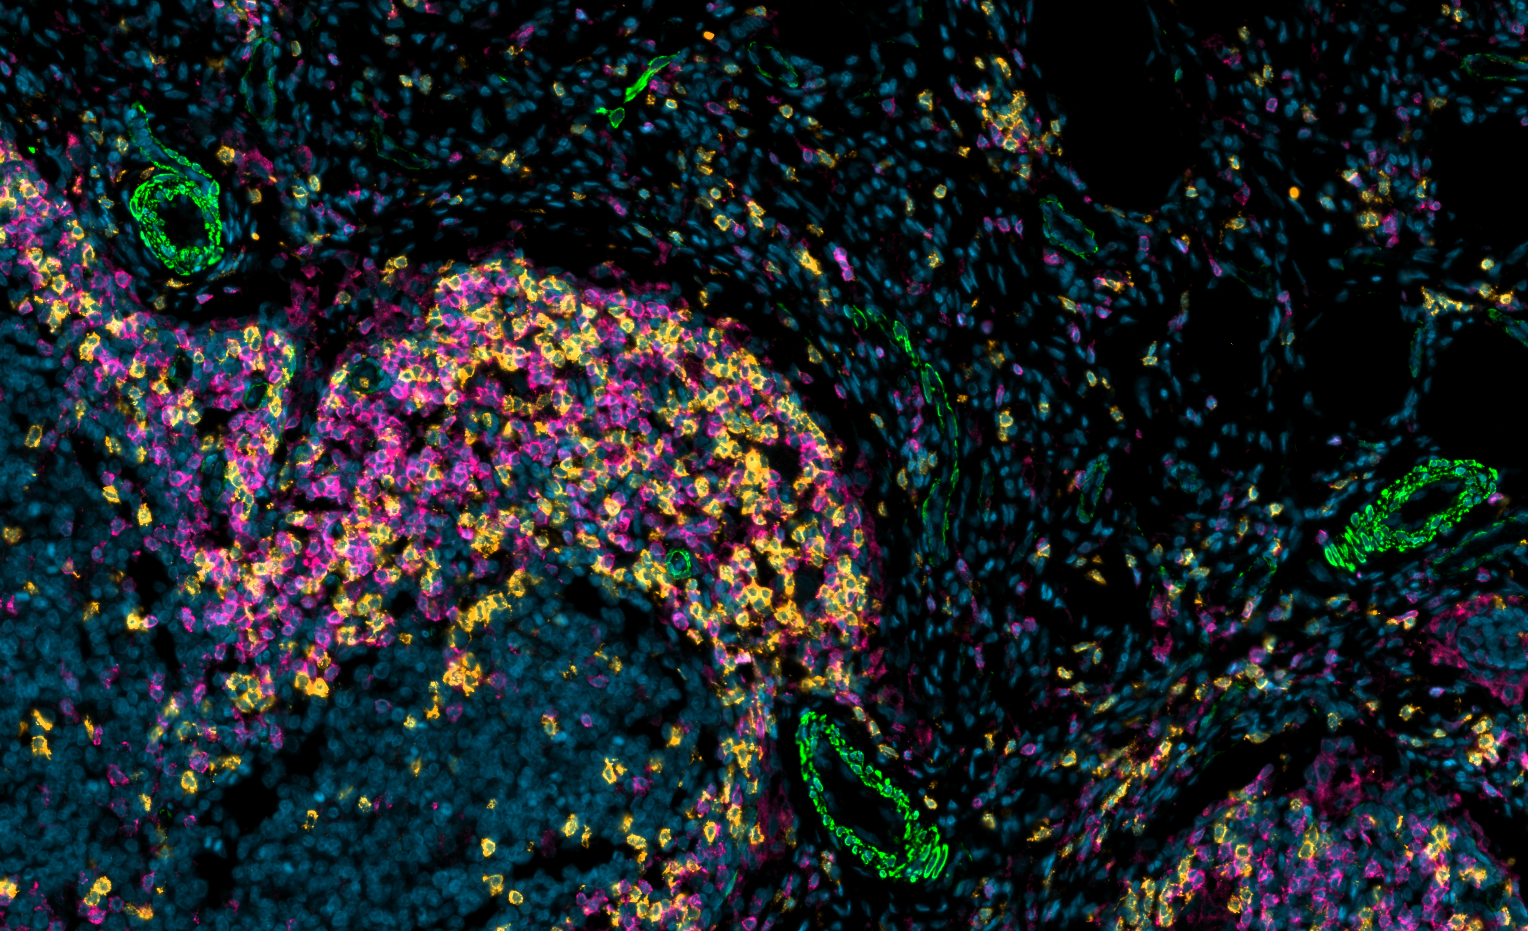
![Lung: CD4, CD8, ASMA, Pan-CK]()
Lung: CD4, CD8, ASMA, Pan-CK
-
![Melanoma TLS: Ki-67]()
Melanoma TLS: Ki-67